S-curve template: free Excel planned vs actual progress chart
Deskely Completions team Singapore
An S-curve plots cumulative progress against time. Planned progress starts slowly, climbs steeply through the middle of the work and flattens near the end, giving the S shape. Plotting actual progress on the same chart shows at a glance whether the work is ahead or behind.
This page gives you a free S-curve template in Excel with the chart built in, and an earned progress sheet to work out actual progress from weighted activities.
- Planned progress comes from the schedule, weighted by hours, quantities or cost.
- Actual progress must be measured the same way as the plan, or the curves cannot be compared.
- The gap between the curves is the variance; its trend matters more than one week.
- For completions, measure progress from records: ITRs signed, punch closed, systems certified.
How an S-curve works
Each activity is given a weight: its share of the total work, usually by budgeted hours. Planned progress per week is the weighted work scheduled for that week; added up, it gives the planned cumulative curve. Actual progress is measured the same way, from what was really done.
Where the actual curve sits below the planned curve, the work is behind; above it, ahead. The steepness shows the rate of progress, so a flattening actual curve in the middle of the job is an early warning.
The template
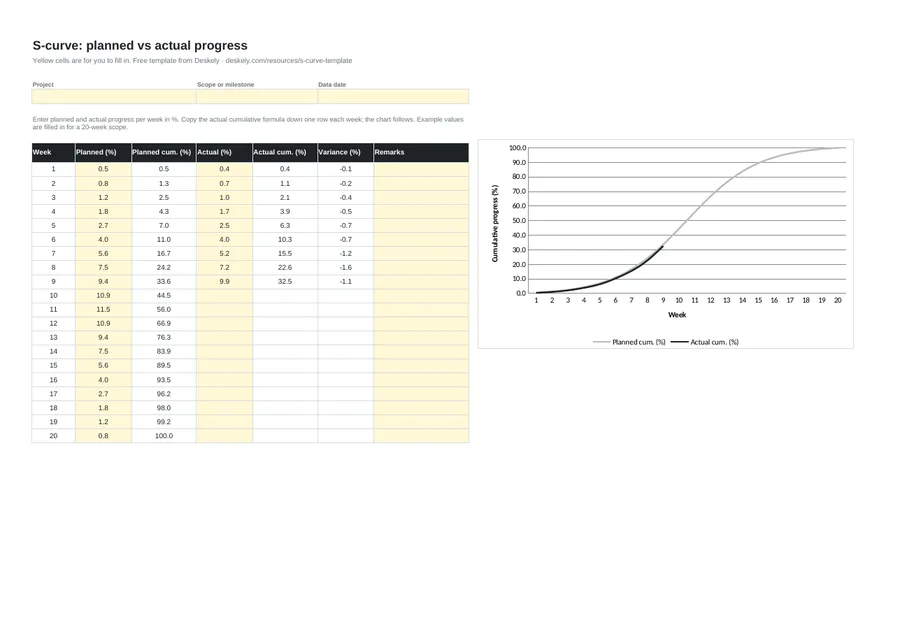
Enter planned and actual progress per week; the cumulative columns, the variance and the chart follow. The second sheet works out actual progress from weighted activities: weight times percentage complete.
S-curves for completions and commissioning
In completions, progress is best measured from the records themselves: ITRs signed, punch items closed, test packs completed, subsystems certified. That makes the actual curve hard to argue with. See the commissioning checklist for the milestones.
Deskely Horizon forecasts readiness by system and subsystem from the completions records, so progress moves as ITRs are signed rather than with a weekly estimate.
The Deskely products for this
Frequently asked questions
What is an S-curve in project management?
A chart of cumulative progress (or cost, or hours) against time. It is S-shaped because work starts slowly, peaks in the middle and tails off at the end.
How do you make an S-curve in Excel?
List the weeks, enter planned and actual progress per week, add cumulative columns, and plot them as a line chart. The template does this for you.
What does it mean if the actual curve is below the planned curve?
The work is behind plan by the gap between the curves at the data date.
How is progress weighted?
Usually by budgeted hours per activity, sometimes by quantities or cost. The same weights must be used for planned and actual.
- In production since 2014
- Thousands of daily users
- On MODEC FPSO projects since 2016